|
Fractal
|
Fractal JMX Tutorial
| AUTHOR : |
|
|
|
N. Rivierre |
|
(France Telecom
R&D) |
| Version |
0.2 |
| Released |
July 17, 2007 |
This document is a tutorial for Fractal JMX v0.2, a set of Fractal
components that enable JMX management of Fractal applications through
automatic exposition in JMX agents.
This version of Fractal JMX is based on the Fractal API and ADL
specification v2.0, and the JavaTM
Management extensions
(JMXTM) Instrumentation and Agent Specification
v1.2.
Readers are expected to have a minimal knowledge of these
specifications.
Fractal JMX is not Julia dependant except for some additional and
optional controllers that allow to equip Fractal
components with basic statistics on method calls.
The Fractal JMX design has benefited from an initial study with an
early prototype in 2003 by Laurent Andrey (Loria), Eric Bruneton,
Thierry Coupaye and Ada Diaconescu
(France Telecom
R&D). It also uses material from JMX4ODP. This
version is on an early stage and will evolve in the future.
Contents
1 Introduction
1.1 Principle
1.2 Naming convention
2 Instrumentation
2.1 Comanche
2.2 Instrumenting and
browsing Comanche
2.3 Simple scenarios
3 Monitoring
3.1 String monitor
3.2 Counter monitor
3.3 Gauge monitor
Appendix A: ADL example (management profile)
Appendix B: Julia configuration with a stat-controller
Appendix C: Remote connexion
1 Introduction
This tutorial covers the steps required to run management-enabled
Fractal applications using Fractal JMX.
This section first introduces the principle and naming convention used
in Fractal JMX. Section 2 and 3 illustrate how to instrument and monitor a
Fractal application.
1.1 Principle
The resources that can be managed using Fractal JMX v0.2 are component
server interfaces or monitors for observing component attributes.
Fractal JMX does not impose intrusive management code or extra metadata
to enable JMX management of these resources.
The JMX agent level, responsible for delegating all the invocations
between the management applications and the managed resources, is
represented in Fractal JMX by a generic and autonomous Fractal agent
component, whose only requirement is to be added in the Fractal
application to be managed. This agent component enables JMX management
of its host application by dynamically exploring the component
structure and creating managed beans (MBeans) that represent either
component server interfaces or monitors for observing component
attributes.
Agent
The core component of Fractal JMX is the agent component that
represents the JMX agent level.
A Fractal application can be managed simply by adding the agent
component in its structure. This Fractal agent component encapsulates a
JMX MBeanServer
and behaves as follows:
- Its Admin
interface specifies a single method ("expose") that allows to
introspect components in the agent scope. Where the scope of the agent
represents its super-components and all sub-components recursively
enclosed in its super-components
(or in itself if the agent has no super-components).
- During the introspection, the agent dynamically creates and
registers MBeans that represent either component server interfaces or
standard JMX
monitors for observing component attributes.
- Since hundreds of MBeans can be generated during the
introspection, the agent also provides an AdminAttributes
interface that allows to filter the relevant MBeans,
to avoid flooding of exposed information and performance penalty.
For example, in the architecture depicted below, where an agent is
added to the composite B:
Figure 1
The component B, C, D and Agent (itself) are in the agent scope and
then candidate to expose MBeans representing
their server interfaces or observer on their attributes. The component
A is not in the agent scope, and then cannot be managed, since it is
not a super-component of the agent.
In practice, although it is possible to add several agents in a
Fractal application, a typical way of using Fractal JMX is to add a
single agent at the root composite level and to use its filter
attributes to select the relevant MBeans.
Composite Agent
The primitive agent component included in the Fractal JMX
distribution can be used alone.
In practice, it is typically composed with listener and adaptor
components
before to be added in Fractal application to be managed:
- A Listener component implements the NotificationListener
interface and handles the notifications sent out by the attribute
observers, if the agent is bound to this interface. It is intended to
be customized if specific processing of the notifications is required.
- An Adaptor component represents any additional MBean that needs
to registers to the Agent component for specific (HTLM, RMI...)
adaptation reason. Several adaptors can be used simultaneously.
A typical case is an HTML adaptor, itself implemented as an MBean, that
will allow
an HTML browser to manage all MBeans in the agent.
A possible way of using these components together is depicted in the
figure below.
Figure 2
This figure shows how these components can be bound to each other to
get a functional composite Agent component, which provides an Admin
interface.
The resulting composite component (named AgentHost in the figure)
behaves as an agent as far it provides an Admin interface,
and can be added in a Fractal application to be managed
Default ADL
A default ADL definition of the
agent architecture depicted in figure 2 is
included in the Fractal JMX distribution.
The composite template:
org.objectweb.fractal.jmx.AgentHost
contains the two following sub-components included in the Fractal JMX
distribution:
- the primitive agent
component configured, by default, with its filter
attributes
set to "" (i.e. no MBean can be registered in the agent during
introspection).
- a basic
listener
component that writes to user screen the notifications received from
the attribute observers.
This component can be customized if specific processing of the
notifications, sent out by the observers, is required.
This composite agent enables JMX management of Fractal applications, as
illustrated below with Comanche.
NB.
Since Fractal JMX v0.2, the
following modifications have been introduced :
- An HTML
Adaptor component has been removed (due to licensing
issues).
- The jvm must be
configured with the
right arguments in
order to make the Fractal JMX MBeanServer externally visible - so that
remote rmi clients (e.g. Jconsole)
can find it and use the available
MBeans registered in this server (see appendix C).
1.2 Naming convention
In JMX, an ObjectName
represents a reference to an MBean in the agent, or a pattern that can
match the names of several MBeans
It is unique within an MBeanServer
and consists of two parts: the domain name and an unordered list of
property-value pairs.
The string representation of an object name must follow the following
syntax:
[DomainName]:property=value[,property=value]*
In Fractal JMX, the object name of an MBean representing a component
server interface uses this syntax as follows:
FC/[path]component@id[shared]:itf=interface
where:
- component: is the name of the component, as returned by NameController.
- interface: is the name of a server interface of the
component, as
returned by InterfaceType.
- path: is a (slash separated) name sequence of the
successive
super-components
of the component, in the reverse order.
- shared: is set to "-shared" if the component may be
identified by
several paths (i.e. if the component or some component, in its
super-component
hierarchy, is shared).
- id: is an inelegant, but unique, component identifier
introduced
to avoid JMX name clashes, since nothing prevents the same Fractal name
sequence to identify several components.
For example, in the architecture depicted in figure 1,
the MBean representing the interface I of the component D is named:
FC/A/B/C/D@56e32:itf=I
where @56e32 represents the unique identifier of component D. It is
generated by the agent and can be ignored.
This naming convention:
- requires components to have a NameController
and to avoid (in component or interface names) characters interpreted
in specific ways by ObjectName
(e.g. ":", "*", "&"...).
- is used by the agent
attributes
to filter the relevant MBeans. Only the MBeans, whose ObjectName
matches a pattern defined by these attributes, are registered in the
agent. These MBeans represent either component server interfaces or
monitors for observing component attributes.
In the latter case, the naming convention used by the agent attributes
considers some additional property-value pairs
reserved for the configuration of JMX monitors.
2 Instrumentation
This section illustrates how to instrument the Comanche application
using Fractal JMX.
2.1 Comanche
Comanche is the minimal HTTP server introduced in "Developing
with Fractal", whose component architecture can be summarized as
follows:
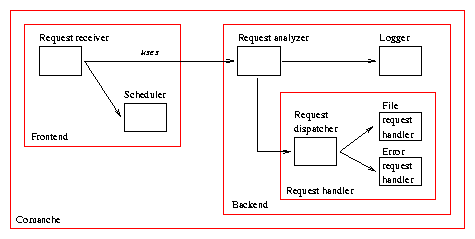
The version of Comanche used in this tutorial is unchanged, except
for the component Logger that implements an additional attribute
controller
interface, specifying an "Header" attribute:
public interface
LoggerAttributes
extends AttributeController {
String
getHeader
();
void
setHeader
(String header);
} |
When Comanche is instanciated (see the example provided in the
Fractal JMX distribution), open this URL in a web browser to display a
simple test page:
http://localhost:8080/index.html
2.2 Instrumenting and browsing Comanche
In "Developing
with Fractal", the ADL definition describing the root composite of
Comanche is as follows (composed of the Frontend and the Backend
sub-components):
<definition name="comanche.Comanche" extends="comanche.ComancheType">
  <component name="fe" definition="comanche.Frontend"/>
  <component name="be" definition="comanche.Backend"/>
  <binding client="this.r" server="fe.r"/>
  <binding client="fe.rh" server="be.rh"/>
</definition>
From section 1, a possible architecture for
instrumenting all Comanche components
is as follows (see appendix A for an alternative
ADL definition that will allow to initialize the default values of the
JMX component attributes):
<definition name="comanche.JmxComanche1" extends="comanche.Comanche">
  <component name="agent"
             definition="org.objectweb.fractal.jmx.AgentHost"/>
</definition>
The additional agent sub-component refers to the AgentHost composite
template definition introduced in the default ADL
section and depicted in figure 2.
It is itself composed of two sub-components (a primitive agent and a
basic listener) included in the JMX Fractal
distribution.
Start the comanche example using "mvn -Prun" in
"..\fractaljmx\examples\comanche". The jvm should be configured (see
the maven pom
file of this
example) with:
- the application argument set to: comanche.JmxComanche1
- a JMX connector listening on port 1234 (see also appendix C)
Start Jconsole
or your own rmi client to connect to the Fractal JMX MBeanServer. NB:
if you don't specify a process ID, Jconsole will automatically
detect all local Java applications, and display a dialog box that lets
you select the one you want to monitor.
Accept the connexion. Jconsole
should provide the following page,
where the following MBeans
are registered (by default in Fractal JMX):
- Agent:itf=admin
represents the Admin
interface of the agent component.
- Agent:itf=attribute-controller represents the AdminAttributes
interface of the agent component.
2.3 Simple scenarios
This section illustrates how to expose component server interfaces with
Fractal JMX,
and then how to update component attributes and invoke component
operations.
The syntax of the agent attribute "ItfPatterns", used in this section
for filtering component interfaces,
is defined in the AdminAttributes
interface as a sequence of (";" separated) string representations of ObjectName
patterns. Only the component interfaces, whose ObjectName matches one
of
these patterns, can be registered in the agent.
First scenario
This scenario exposes all server interfaces of all Comanche
components. The first step is to set the agent attribute "ItfPatterns",
for filtering component interfaces:
- browse the MBean "Agent:itf=attribute-controller" to display the
attribute-controller interface (AdminAttributes)
of the agent component.
- set the filter attribute "ItfPatterns" with the value:
*:*
At this stage, the value of the filter attribute "ItfPatterns"
represents
a pattern that can match all component server interfaces. The second
step
is to register MBeans in the agent:
- browse the MBean "Agent:itf=admin" to display agent component Admin
interface.
- click the "expose" operation's button to invoke this operation.
At this stage, all server interfaces of all Comanche components are
registered
in the agent and should be exposed.
It is then possible to browse these
interfaces in order to get/set components attributes
or invoke component operations.
Second scenario
This scenario modifies the "Header" attribute of the logger
component.
This component is a sub-component of the Backend component, that in
turn
is a sub-component of the root composite of comanche (see Comanche). The first (optional) step is to
select the relevant
interfaces, to avoid flooding of exposed information:
- browse the MBean "Agent:itf=attribute-controller".
- set the filter attribute "ItfPatterns" with the value (see appendix
A to initialize this value from an ADL definition, instead of
modifying it from the browser):
*/l*:itf=attribute-controller;*/l*:itf=l
- browse the MBean "Agent:itf=admin" and click the "expose"
operation's
button
At this stage, only the attribute-controller and the fonctional
interfaces
l of the logger component are registered in the agent.
The second
(optional)
step is check the current value of the "Header" attribute of the logger
component (by default, the string "->").
- browse the MBean "FC/JmxComanche/be/l:itf=l"
- click its "log" operation's button. If the string "test" is used
as
argument,
the following message should appear in the console:
-> test
The last step is to modify the header used by the logger:
- browse the MBean "FC/JmxComanche/be/l:itf=attribute-controller".
- set the attribute "Header" with the value:
foo
- browse the MBean "FC/JmxComanche/be/l:itf=l" and click the "log"
operation's
button (again with the string "test" as argument). The following
message
should be printed in the console:
3 Monitoring
This section illustrates how the standard
JMX
monitors (counter, gauge and string) can be used with Fractal JMX
to observe component attributes
of the Comanche application. Note that the
listener component used in this section is the BasicListener
(see the ADL definition "JmxComanche1").
This listener writes to user screen the notifications received from the
observers. It can be customized if specific processing of the
notifications is required.
3.1 String monitor
The standard JMX
string monitor enables the observation of attributes of type
String.
It can be configured to trigger a notification when the observed
attribute matches or differs from a compared string. In scenario 2, the "Header" attribute of the
logger component of Comanche has been modified.
This can be observed with Fractal JMX as follows:
- browse the MBean "Agent:itf=adminAttributes".
- set the filter attribute "MonitorStringPatterns" with the value
(see appendix
A to initialize this value from an ADL definition, instead of
modifying it from the browser):
*:itf=attribute-controller,observedAttribute=Header,granularityPeriod=5000,
stringToCompare=foo,notifyDiffer=true,notifyMatch=true
- browse the MBean "Agent:itf=admin" and click the "expose"
operation's
button
The syntax of this filter attribute "MonitorStringPatterns" is defined
in AdminAttributes
as a sequence of (";" separated) string representations of ObjectName
patterns. Where the following properties are reserved for the
configuration
of a string
monitor (as defined in the JMX specification):
- observedAttribute: the attribute being observed.
- granularityPeriod: the granularity period (in
milliseconds).
- stringToCompare: the string to compare with the observed
attribute.
- notifyDiffer: the differing notification's on/off switch
value.
- notifyMatch: the matching notification's on/off switch
value.
The proposed value for the "MonitorStringPatterns" attribute represents
a pattern that can
match the attribute-controller interface of any component, if this
interface
specifies a string attribute "Header". This attribute will be monitored
every 5000 ms and compared with the value "foo". Coming back to scenario
2, the following differ
notification should be printed now in the console when the value of
the "Header" attribute first differs from the value "foo" (subsequent
differences
from "foo" do not cause further notifications unless the attribute
value
matches "foo"):
*****
String
Monitor
*
NotificationType: jmx.monitor.string.differs
* Src:
AgentService:type=stringMonitor,observer=1
*
ObservedObject: FC/JmxComanche/be/l:itf=attribute-controller
*
ObservedAttribute: Header
* Trigger:
foo
*
DerivedGauge:
->
*****
Similarly, the following match
notification should be printed in the console when the value of the
"Header" attribute first matches the value foo (subsequent matchings of
"foo" do not cause further notifications unless the attribute value
differs
from "foo"):
*****
String
Monitor
*
NotificationType: jmx.monitor.string.matches
* Src:
AgentService:type=stringMonitor,observer=1
*
ObservedObject: FC/JmxComanche/be/l:itf=attribute-controller
*
ObservedAttribute: Header
* Trigger:
foo
*
DerivedGauge: foo
*****
The format of these messages is described in BasicListener
and relies on the information encapsulated in the received MonitorNotication.
3.2 Counter monitor
The standard JMX
counter monitor observes the attributes that are integer types and
behaves like counters.
This section illustrates how counter monitors can be used with Fractal
JMX to observe method calls that have
been made on component server interfaces. Since the standard JMX
monitors (counter, gauge and string) only allow to observe
attributes
(i.e. getter methods), this section also illustrates how to equip
Fractal components
with a stat-controller
that exposes attributes representing statistics on method calls.
Note that the stat-controller implementations included in the
Fractal JMX distribution i) are basic, and intended to be customized if
more advanced statistics on method calls are required
and ii) are the only part of Fractal JMX that is Julia dependant
(see appendix B for a configuration example).
First scenario
In this scenario, we are interested to send a notification each time
the number of method calls made on the logger component of Comanche
reaches
a threshold value. The first step is to equip this component with a stat-controller
that exposes a "NumberOfMethodCall" attribute acting as a counter (this
attribute is incremented each time a method
call is made on the component).
This can be done with the following ADL definition (where
"statPrimitive" is an alias defined in the Julia configuration file,
see appendix B):
<definition name="comanche.Logger" extends="comanche.LoggerType">
  <content class="comanche.BasicLogger"/>
  <attributes signature="comanche.LoggerAttributes">
    <attribute name="Header" value="->"/>
  </attributes>
  <controller desc="statPrimitive"/>
</definition>
The second step is to set the agent attribute for filtering counter
monitor MBeans:
- browse the MBean "Agent:itf=adminAttributes".
- set the filter attribute "MonitorCounterPatterns" with the value
(see appendix
A to initialize this value from an ADL definition, instead of
modifying it from the browser):
*:itf=stat-controller,observedAttribute=NumberOfMethodCall,granularityPeriod=5000,
initThreshold=2,modulus=0,offset=3,differenceMode=false
- browse the MBean "Agent:itf=admin" and click the "expose"
operation's
button
The syntax of this filter attribute "MonitorCounterPatterns" is defined
in AdminAttributes
as a sequence of (";" separated) string representations of ObjectName
patterns. Where the following properties are reserved for the
configuration
of a counter
monitor (as defined in the JMX specification):
- observedAttribute: the attribute being observed.
- granularityPeriod: the granularity period (in
milliseconds).
- initThreshold: the initial threshold value.
- modulus: the modulus value.
- offset: the offset value.
- differenceMode: the difference mode flag value.
The proposed value for the "MonitorCounterPatterns" attribute
represents a pattern that can
match the stat-controller interface of any component, if this interface
specifies an integer attribute "NumberOfMethodCall" (as it the case for
BasicStatController).
This attribute will be monitored every 5000 ms, as defined in the JMX
specification
for a
counter
monitor configured with: InitThreshold=2, Modulus=0,
Offset=3 and DifferenceMode=false.
Threshold
notifications should be printed in the console when the value of
this
attribute reaches 2 (since the initial threshold equals 2) and then 5,
8, 11,... (since the offset equals 3). This can be verified by
iterating
several times on the following sequence :
- browse the MBean "FC/JmxComanche/be/l:itf=l"
- click its "log" operation's button.
A more convenient alternative is to browse several times the commanche
application
(e.g. on http://localhost:8080/index.html).
The logger component being equiped with a
stat-controller,
the following message should appear in the console when the "log"
operation
of the logger component is called the second time (i.e. when the
"NumberOfMethodCall" attribute reaches 2):
*****
Counter
Monitor
*
NotificationType: jmx.monitor.counter.threshold
* Src:
AgentService:type=counterMonitor,observer=1,attributeType=java.lang.Integer
*
ObservedObject: FC/JmxComanche/be/l:itf=stat-controller
*
ObservedAttribute: NumberOfMethodCall
* Trigger: 2
*
DerivedGauge: 2
*****
Similar messages are printed when the "log" operation of the logger
component
is called 5, 8, 11,... times (since the counter monitor is configured
with Offset=3).
The format of these messages is described in
BasicListener
and relies on the information encapsulated in the received MonitorNotication.
Second scenario (throughput)
As defined in the JMX specification, the counter
monitor can be configured (with the difference mode flag set to
true) to send a
threshold
notification when the difference between two successive
observations
reaches a threshold value. Coming back on the previous scenario, it is
then possible to observe if the number of calls to the "log" operation
of
the logger component reaches a given througput during a sampling
period:
- browse the MBean "Agent:itf=adminAttributes".
- modify the filter attribute "CounterStringPatterns" as follows
(see appendix
A to initialize this value from an ADL definition, instead of
modifying it from the browser):
*:itf=stat-controller,observedAttribute=NumberOfMethodCall,granularityPeriod=5000,
initThreshold=2,modulus=0,offset=0,differenceMode=true
- browse the MBean "Agent:itf=admin" and click the "expose"
operation's
button
In this configuration, threshold
notifications should be printed in the console each time the "log"
operation of the logger component is called two (or more) times per
sampling
period of 5 seconds (since the difference mode equals true, the
initial
threshold equals 2 and the granularity period equals 5000
milliseconds).
Another way of monitoring throuhput is explained in the next section.
3.3 Gauge monitor
The standard JMX
gauge monitor observes the attributes that are integer or floating
point types and whose values fluctuate
between high and low thresholds. This section illustrates how gauge
monitors
can be used with Fractal JMX to observe the througput of method calls
that have been made
on component server interfaces.
As explained for counter monitor, the first
step is to use a stat-controller
that exposes attributes representing statistics on method calls that
have
been made on the server interfaces of a component. The second step is
to
set the agent attribute for filtering gauge
monitor MBeans:
- browse the MBean "Agent:itf=adminAttributes".
- set the filter attribute "MonitorGaugePatterns" with the value
(see appendix
A to initialize this value from an ADL definition, instead of
modifying it from the browser):
*:itf=stat-controller,observedAttribute=RateOfMethodCall,granularityPeriod=5000,
lowThreshold=0.01,highThreshold=0.3,differenceMode=false
- browse the MBean "Agent:itf=admin" and click the "expose"
operation's
button
The syntax of this filter attribute "MonitorCounterPatterns" is defined
in AdminAttributes
as a sequence of (";" separated) string representations of ObjectName
patterns. Where the following properties are reserved for the
configuration
of a gauge
monitor (as defined in the JMX specification):
- observedAttribute: the attribute being observed.
- granularityPeriod: the granularity period (in
milliseconds).
- lowThreshold: the low threshold value.
- highThreshold: the high threshold value.
- differenceMode: the difference mode flag value.
The proposed value for the attribute filter represents a pattern that
can
match the stat-controller interface of any component, if this interface
specifies an integer or floating point attribute "RateOfMethodCall" (as
it the case for BasicStatController).
This attribute will be monitored every 5000 ms, as defined in the JMX
specification
for a
gauge
monitor configured with: LowThreshold=0.01,
HighThreshold=0.3,
and DifferenceMode=false.
Coming back to the counter monitor
scenarios, the following threshold
low notification should be printed now in the console (at the
begining of the session):
*****
Gauge
Monitor
*
NotificationType: jmx.monitor.gauge.low
* Src:
AgentService:type=counterMonitor,observer=1,attributeType=java.lang.Integer
*
ObservedObject: FC/JmxComanche/be/l:itf=stat-controller
*
ObservedAttribute: RateOfMethodCall
* Trigger:
0.01
*
DerivedGauge: 0.0
*****
This is normal since the "log" operation of the logger component has
not be called.
The gauge monitor has a low threshold equals to 0.01 when the observed
attribute "RateOfMethodCall" of the stat-controller
(representing the throuhput observed during the last period) equals 0.
Similarly, a threshold
high notification should be printed in the console when the "log"
operation of the logger component is called several times (e.g. by
browsing several times the commanche application on
http://localhost:8080/index.html). For example:
*****
Gauge
Monitor
*
NotificationType: jmx.monitor.gauge.high
* Src:
AgentService:type=counterMonitor,observer=1,attributeType=java.lang.Integer
*
ObservedObject: FC/JmxComanche/be/l:itf=stat-controller
*
ObservedAttribute: RateOfMethodCall
* Trigger:
0.3
*
DerivedGauge:
0.587
*****
The gauge monitor has a high threshold equals to 0.3 when the observed
attribute "RateOfMethodCall" of the stat-controller
(representing the throuhput observed during the last period) equals
0.587 calls per second.
The format of these messages is described in
BasicListener
and relies on the information encapsulated in the received MonitorNotication.
Appendix A: ADL example (management profile)
This appendix illustrates how to define a management profile with
Fractal JMX. This can be done by
initializing the Fractal JMX component
attributes from an ADL definition, instead of modifying them from the
browser. This new ADL definition of the Comanche root composite (named
now "JmxComanche2") has to be compared with the
versions proposed in section 2.2.
The JmxComanche2 definition is similar to the JmxComanche1
definition
proposed in section 2.2,
i.e. it contains an additional agent sub-component composed of two
sub-components (a primitive agent and a basic listener) as depicted in figure 2.
The only differences come from the attributes of the primitive agent
that are overloaded to
filter the relevant MBeans, as described in this tutorial.
<definition name="comanche.JmxComanche2"
extends="comanche.Comanche">
  <component name="agent" definition="org.objectweb.fractal.jmx.AgentHost">
    <component name="agent">
      <attributes>
        <attribute name="ItfPatterns" value="*/l*:itf=attribute-controller;*/l*:itf=l"/>
        <attribute name="MonitorStringPatterns"
                   value="*:itf=attribute-controller,     // WARNING: This string value is
                            observedAttribute=Header,     // formated only for documentation
                            granularityPeriod=5000,       // purpose. Remove this comment,
                            stringToCompare=foo,          // white spaces and carriage returns
                            notifyDiffer=true,            // in actual Fractal ADL files.
                            notifyMatch=true"/>
        <attribute name="MonitorCounterPatterns"
                   value="*:itf=stat-controller,          // WARNING: see above
                            observedAttribute=NumberOfMethodCall,
                            granularityPeriod=5000,
                            initThreshold=2,
                            modulus=0,
                            offset=3,
                            differenceMode=false"/>
        <attribute name="MonitorGaugePatterns"
                   value="*:itf=stat-controller,          // WARNING: see above
                            observedAttribute=RateOfMethodCall,
                            granularityPeriod=5000,
                            lowThreshold=0.01,
                            highThreshold=0.3,
                            differenceMode=false"/>
      </attributes>
    </component>
  </component>
</definition>
Using this ADL definition, Jconsole
should provides the
following page after starting the session:
Browse the MBean "Agent:itf=admin" and click the "expose"
operation's
button to activate the management profile. This way the ressources and
monitors described in the previous section are automatically exposed
and activated.
Appendix B: Julia configuration with a
stat-controller
The "statPrimitive" alias can be defined as follows in the Julia
configuration
file. It is similar to the usual "Primitive" alias except for an
additional
BasicStatController
included in the Fractal JMX distribution.
This controller:
- implements the StatController
interface and must be associated with the StatCodeGenerator
that generates interception code.
- can be configured with a parameter representing the minimal time
interval
used for rate re-computation, in milliseconds (the proposed value is
5000).
- can be replaced by the ExponentialSmoothingStatController
(also included in the Fractal JMX distribution) that uses a basic
exponential smoothing method for rate computation.
A second parameter is then available to adjust the smoothing constant
used by this implementation (the proposed value is 0.5).
(statPrimitive
(
'interface-class-generator
(
'component-itf
'binding-controller-itf
'super-controller-itf
# only if super-controller-itf does
not designate the Julia interface:
# 'julia-super-controller-itf
'lifecycle-controller-itf
# only if lifecycle-controller-itf does
not designate the Julia interface:
# 'julia-lifecycle-controller-itf
'name-controller-itf
(stat-controller
org.objectweb.fractal.jmx.julia.stat.StatController)
)
(
'component-impl
'container-binding-controller-impl
'super-controller-impl
'lifecycle-controller-impl
'name-controller-impl
(org.objectweb.fractal.jmx.julia.stat.BasicStatController 5000)
#
(org.objectweb.fractal.jmx.julia.stat.ExponentialSmoothingStatController
5000 0.5)
)
(
(org.objectweb.fractal.julia.asm.InterceptorClassGenerator
org.objectweb.fractal.julia.asm.LifeCycleCodeGenerator
org.objectweb.fractal.jmx.julia.stat.StatCodeGenerator
)
)
org.objectweb.fractal.julia.asm.MergeClassGenerator
'optimizationLevel
)
) |
Appendix C: Remote
connexion
The jvm must
be configured with the
right arguments in
order to make the Fractal JMX MBeanServer externally visible - so that
remote rmi clients (e.g. Jconsole)
can find it and use the available
MBeans registered in this server.
For example, you can use the following arguments to start the jvm with
a JMX remote agent enabled, with no authentication or ssl security and
with a JMX connector listening on port 1234:
-Dcom.sun.management.jmxremote.port=1234
-Dcom.sun.management.jmxremote.authenticate=false
-Dcom.sun.management.jmxremote.ssl=false
These arguments are well-explained in the j2se documentation
(e.g. for j2se
1.5 from here
or for j2se 1.6 from here).
This is illustrated in the comanche example of Fractal JMX, which can
be managed with Jconsole
or your own rmi client. The maven configuration of the remote connexion
part of this example should look like:
...
<systemProperties>
...
<systemProperty>
<key>com.sun.management.jmxremote.port</key>
<value>1234</value>
</systemProperty>
<systemProperty>
<key>com.sun.management.jmxremote.authenticate</key>
<value>false</value>
</systemProperty>
<systemProperty>
<key>com.sun.management.jmxremote.ssl</key>
<value>false</value>
</systemProperty>
....
</systemProperties>
NB: Using maven with j2se 1.5 requires to set the MAVEN_OPTS
environment variable with these jvm arguments (this is not
required with j2se 1.6).
MAVEN_OPTS=-Dcom.sun.management.jmxremote.port=1234
-Dcom.sun.management.jmxremote.authenticate=false
-Dcom.sun.management.jmxremote.ssl=false
| |